Tax Dollars and Voting Patterns
By Kevin Robinson in News on Apr 13, 2010 3:40PM
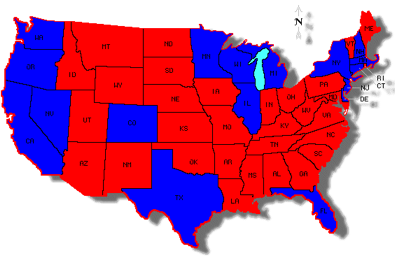
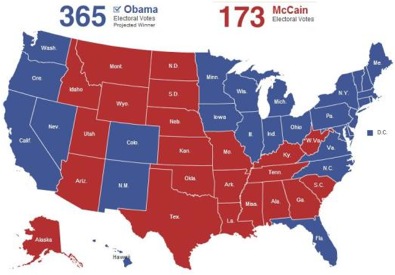
Rich Miller at Capitol Fax presented two interesting maps for comparison yesterday: a graphic showing which states get more than a dollar back in federal spending for every dollar sent to Washington in taxes, and a graphic showing how those states voted in the last presidential election. The rub? Except for eight states, all of those receiving less in federal spending than they contribute voted for Barack Obama, including Illinois. Does this make us in the Midwest exceptionally generous? Or foolish with our cut of federal spending?

