Geotagging How We Move
By Chuck Sudo in News on Jan 23, 2012 11:20PM
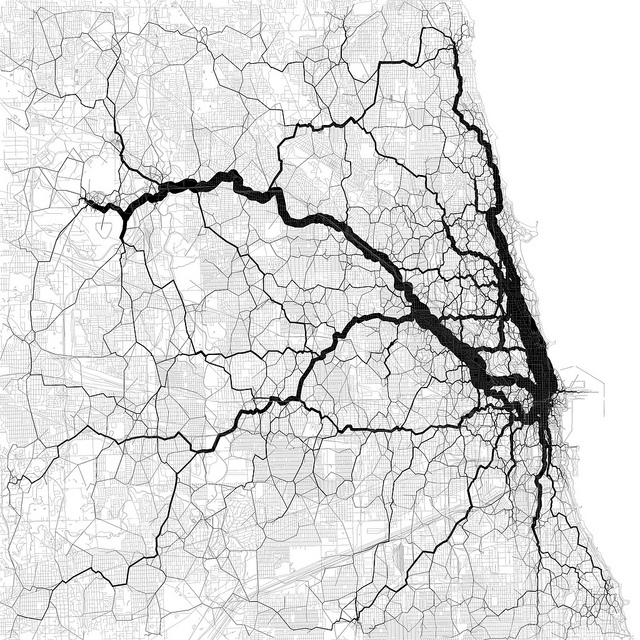
Image Credit: Eric Fisher. (Data from the Twitter streaming API (10000 points, 30000 vectors). Base map from OpenStreetMap, CC-BY-SA)
Eric Fisher has a keen interest in "understanding the workings of cities." Fisher uses geotagging to get a bearing on how people in urban areas travel from one place to another. "I've been using geotagging for a couple of years," Fisher told us by phone this morning.
Fisher used the algorithms for his latest series on how people travel from one place to another for only a couple of days, so he cautioned us on citing the images in his Flickr pool as gospel. What is interesting about the images and how Fisher implemented the geotagging data on them is how Chicagoans travel.
We had to look long and hard at this map to see that the movements of who he charted are at their most dense when they mirror CTA's and Metra's train system. The heaviest density appear to be along the Red line along Clark Street, and the Blue line as it parallels Milwaukee Avenue. Connecting the two are tags that shape out the downtown Loop.
Fisher said in a comment on Flickr the one spot that seems suspect is the curve to the southwest. But even that seems to correspond to the Orange Line or a Metra line heading southwest. The one thing Fisher seemed certain of was that "people tweet from commercial areas."