New Numbers On CPS Per-Pupil Spending Tell Different Story Than This Infographic
By Kevin Robinson in News on Jun 19, 2013 9:00PM
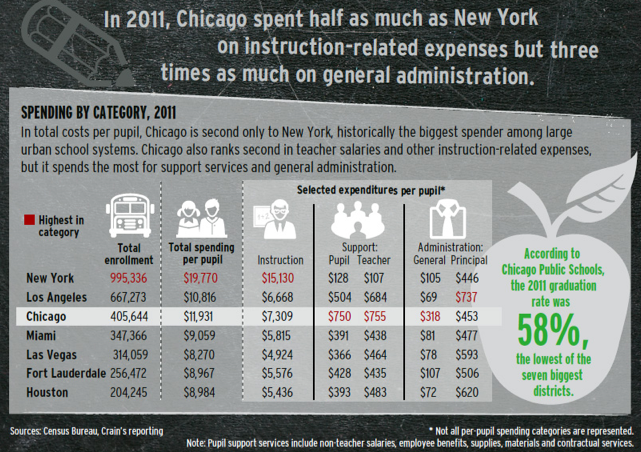
As word gets around the city of budget cuts, teacher layoffs and a lack of toilet paper in neighborhood schools (sources tell Chicagoist that Kelly High School will see a $1 million cut this coming year, with an attendant loss of 23 teaching positions), Crain's Chicago Business helpfully shared an infographic Tuesday showing per-pupil spending in large school districts around the nation.
The infographic shows Chicago has the highest spending per pupil in the nation. But the numbers Crain's used are from 2011. Nevermind that Crain's is publishing information that is two years out of date, the aggregate number is misleading: A look at spending by category shows the skewed priorities of CPS management and the Board of Education (which, it should be noted, is entirely appointed by the mayor).
Chicago spent less than half of what New York City spends per pupil on instruction, while spending three times as much on general administrative costs. If you divide the total 2011 budget by the number of enrolled students it does come to $11,000 per pupil, but two-thirds of those costs are spent on overhead and administration, rather than instruction—almost the total opposite of New York City's education system.
More importantly, Crain's fails to point out that CPS' budget for the 2013-14 school year is $4,429 for K-3, and $4,140 for Grades 4-8, making Chicago's spending per pupil one of the lowest of the school districts featured on the infographic.
Of course, we don't know how much is going for overhead and administration because that would involve current CPS budget numbers.
