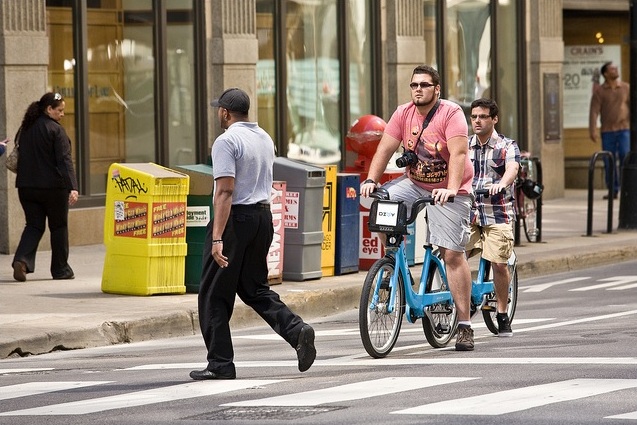
Join The Divvy Data Challenge
By Chuck Sudo in News on Feb 12, 2014 10:15PM
2013 was The Year of Divvy, with over 750,000 trips logged on Chicago’s bike sharing program. But where are riders going when they reserve a bike? How often and long are they using Divvy? Is the program adequately leveraging Chicago’s public transit system and allowing riders to finish short trips? How are the differences between weekday and weekend usage?
Divvy and the local tech startup hub 1871 is looking for hackers, analysts, designers and others to answer these and other questions as part of the Divvy Data Challenge. Interested participants have until March 11 to submit infographics, charts, visualizations and other creative ways of breaking down the Divvy data for consumption by a mass audience, with prizes being awarded for “Best Overall Visualization,” “Most Beautiful,” “Most Comprehensive,” “Most Insightful,” and “Most Creative.”
Each Divvy trip has been made anonymous and will include:
• Trip start day and time
• Trip end day and time
• Trip start station
• Trip end station
• Rider type (Member or 24-Hour Pass User)
• If a Member trip, it will also include Member’s gender and year of birth
Chicago Department of Transportation Commissioner Rebekah Scheinfeld said, “We are excited to see how this open data will be represented through creative infographics and animations to tell the story of how bike sharing is used in Chicago.”
Entries in each category will receive two Divvy memberships, a Divvy t-shirt, five 24-Hour Passes to share with friends and family, and gift certificates for two Bern helmets. All entries will be featured on the Divvy website and will be displayed in 1871 during the month of April. To submit your entries, email Data@Divvybikes.com.
