Get On Your Marks For The Divvy Data Challenge
By Danette Chavez in News on Mar 10, 2015 7:00PM
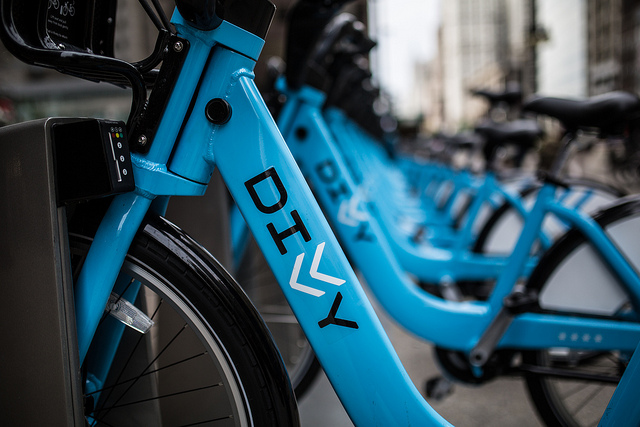
The use of Divvy, Chicago's other public transit system, hasn't slowed down since the program's inception in 2013. The blue-and-white kiosks are already all over town and this spring will see the addition of 175 stations and 1750 more bikes. The bike share program's second annual Data Challenge is currently underway, so if you've got some GIS moves or design skills, get ready to use them to win some sweet swag.
Divvy launched its Data Challenge in 2014, as both a celebration and examination of the millions of trips that had been taken over the course of that year. The company makes trip data available to contest participants who must find a way to illustrate answers to questions such as how far Divvy users rode, which stations saw the most traffic and if any interesting patterns emerged. Yes, it's just as complicated as it sounds; but take a look at last year's winners for inspiration.
The data (for over 3 million rides) has been anonymized and covers the following:
- Trip start day and time
- Trip end day and time
- Trip start station
- Trip end station
- Rider type (Member or 24-Hour Pass User)
- If a Member trip, it will also include Member's gender and year of birth
Contest categories include "Best Overall Visualization," "Most Comprehensive" and "Most Beautiful." This year for the challenge, Divvy has partnered with Microsoft and RedEye Chicago. Prizes include a Windows Phone, an Xbox One, print publication of your entry and gift certificates for Divvy memberships.
Submit your entry to Data@DivvyBikes.com by March 18. Be sure to attach your digital documents and/or include links to video entries that are hosted on your personal site or a third party's. See contest rules here.
