Map: How Are Rents Changing Along CTA Lines?
By Emma G. Gallegos in News on Aug 27, 2015 8:07PM
A recent survey looks at how one-bedroom rental prices have changed over the past ten months. The news actually wasn't all terrible for renters—rent prices didn't go up in most neighborhoods and it went down in quite a few. Yes, we and our friends in Logan Square and Lakeview are shocked, too.
RadPad surveyed listings in October 2014 and then compared them to prices in August 2015. It focused on neighborhoods near CTA stops. Median rent prices did not really go up in 62 percent of the neighborhoods surveyed, which is good news given the way rent prices have been skyrocketing in other major cities.
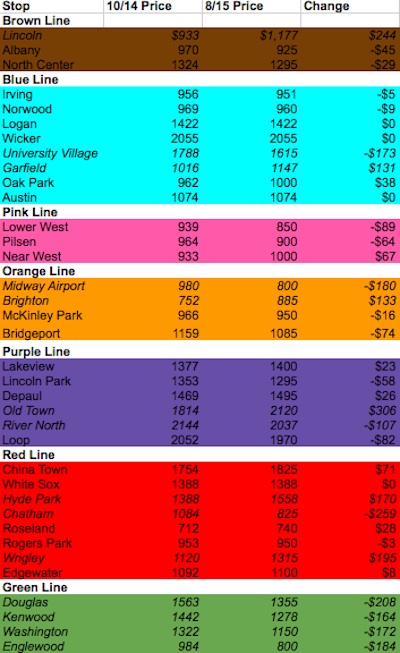
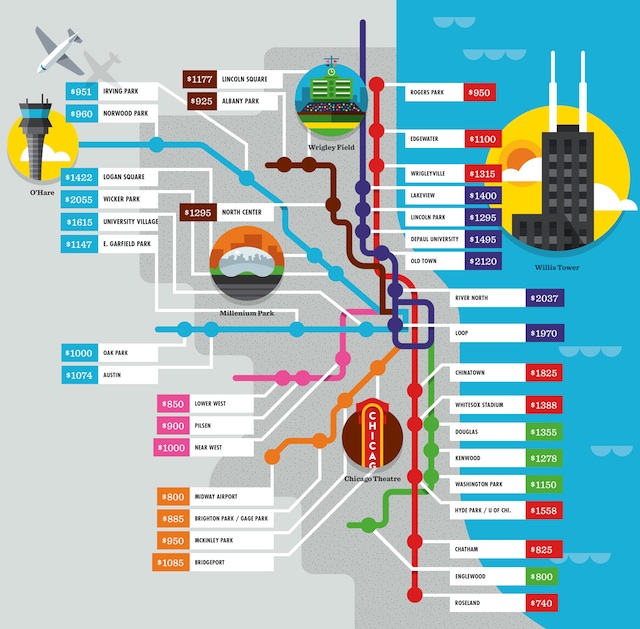
However, some neighborhoods did see some pretty substantial spikes over the last year. Rent in Old Town jumped the most from $1,814 last year to $2,120 this year, overtaking both Wicker Park ($2,055) and The Loop ($1,970) to become the priciest hood surveyed. Lincoln Park saw a $244 jump, meaning its median rent is now $1,177.
The neighborhood that saw the biggest drop was Chatham: rent went down $259 so now a one-bedroom averages $825. Along the Green Line, Hyde Park saw a bump of $170 to $1,558. Rent dropped almost everywhere on the South Side along the Green Line. Douglas ($1,355), Kenwood ($1,278), Washington ($1,150) and Englewood ($800) all dropped over $160.
The infographic above gives you a sense of what rent prices look like around the city and the graph below shows you how prices have moved over the last ten months: