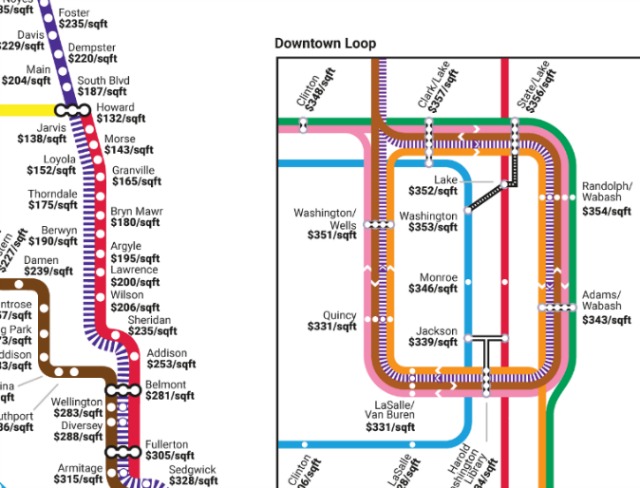
Map Shows Vast Disparity In Real Estate Prices By CTA Station
By Stephen Gossett in News on Jun 13, 2016 6:49PM
 For the full map, head to Estately's website.
A whopping difference of $354 per square foot exists between the most expensive 'L' stop to purchase a home near and the least expensive, according to a study released Monday by Estately. Homes near the Near North Side's Red Line Grand CTA station are most expensive, with an average of $366 per square foot, while homes near the Halsted Street Green Line stop are least expensive, averaging a mere $12 per square foot. (For comparison, the average cost of a home in Detroit last year was $29 per square foot.)
The study analyzed home sales over the last six months (November 18, 2015 to May 18, 2016) for home purchases within a half-mile radius of each CTA 'L' stop.
In breaking down home costs averages by transit line, the Orange Line surprisingly ranked number one, ahead of the far north-serving Purple Line-although it makes sense when factoring the Orange Line's Loop averages, too.
The top five most expensive stops in terms of home price are, predictably, all located in the Loop or Near North Side:
1) Grand (Red): $366/sqft
2) Merchandise Mart: $360/sqft
3) Clark/Lake: $357/sqft
4) State/Lake: $356/sqft
5) Chicago (Red): $355/sqft
Four of the top five least expensive stops are located on the South Side. The other (Cicero Blue Line) serves the West Side. The drop in cost compared to the most expensive stops is vertiginous:
1) Halsted (Green), Englewood: $12/sqft
2) Ashland/63rd (Green), West Englewood: $16/sqft
3) 63rd (Red), Englewood: $22/sqft
4) Cicero (Blue), Austin: $25/sqft
5) 69th (Red), Greater Grand Crossing: $27/sqft
Bear in mind this refers only to home prices, and not rental rates, where proximity to 'L' transit can be a whole 'nother can of worms. We wrote about how rents compare across L train lines last year, and saw some similar trends.