Maps Show How Illinois Voted In The 2016 Presidential Election
By Rachel Cromidas in News on Nov 9, 2016 6:53PM

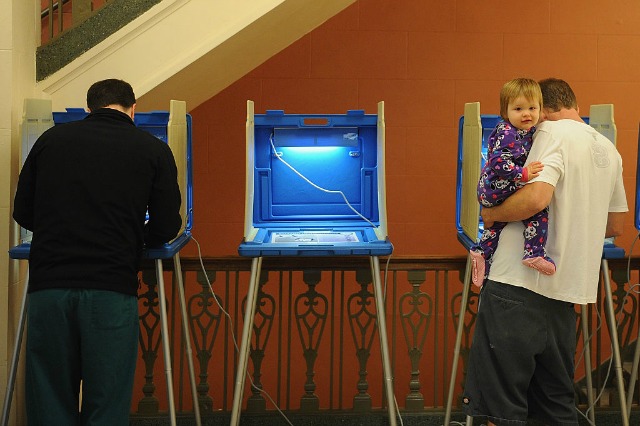
ALTON, IL (Photo by Michael B. Thomas/Getty Images)
Illinois is looking redder than ever after Tuesday night's election cycle thanks to the state's longstanding urban-exurban divide.
The state handily went to Hillary Clinton on Tuesday night, with Clinton winning 55.4 percent of the state's popular vote over Trump at 39.4 percent. Nonetheless, maps of how people voted indicate the divide between Cook County, its surrounding suburbs, and the rest of the state is still strong:
Illinois presidential voting results from 2008 compared to 2016 #twill pic.twitter.com/xgkZhiaRlE
— ILCampaign (@ILCampaign) November 9, 2016
The Tribune pulled out some notable details from their maps of Illinois' votes. For example, Trump took Wayne County, downstate, with 80 percent of the vote. Peoria, Champaign and East St. Louis were the only blue downstate cities.
Chicago area's votes for Hillary Clinton overtook those for Donald Trump in rest of state, via @ChiTribGraphics. https://t.co/Bl5CNOGFTy pic.twitter.com/AAEts1l4Wx
— Chicago Tribune (@chicagotribune) November 9, 2016
As for the city itself: DNAinfo reports, unsurprisingly, that the city went overwhelmingly blue, with little pockets of Trump voters in places such as Mt. Greenwood on the far South Side, the far Southwest Side, and near the northern suburbs.
According to the Chicago Board of Elections, Chicago voter turnout will be around 70 percent this election, despite previous estimates of 73-74 percent.